Blood Pressure Diary
Quick Start
Introduction
The Blood Pressure Diary web application (bplog.io) allows you to record your blood pressure readings, analyze them through a variety of charts, and generate reports for your doctor that can be printed or sent as files.
- Fast and simple data entry — just eight taps on a phone or seven keystrokes on a computer, typically taking no more than 8 seconds.
- Comprehensive visualizations — a full set of charts and diagrams to help you analyze your blood pressure trends over any period.
- Automatic diary creation — generates a standard morning and evening log, commonly requested by doctors for patients with suspected cardiovascular conditions.
Diary
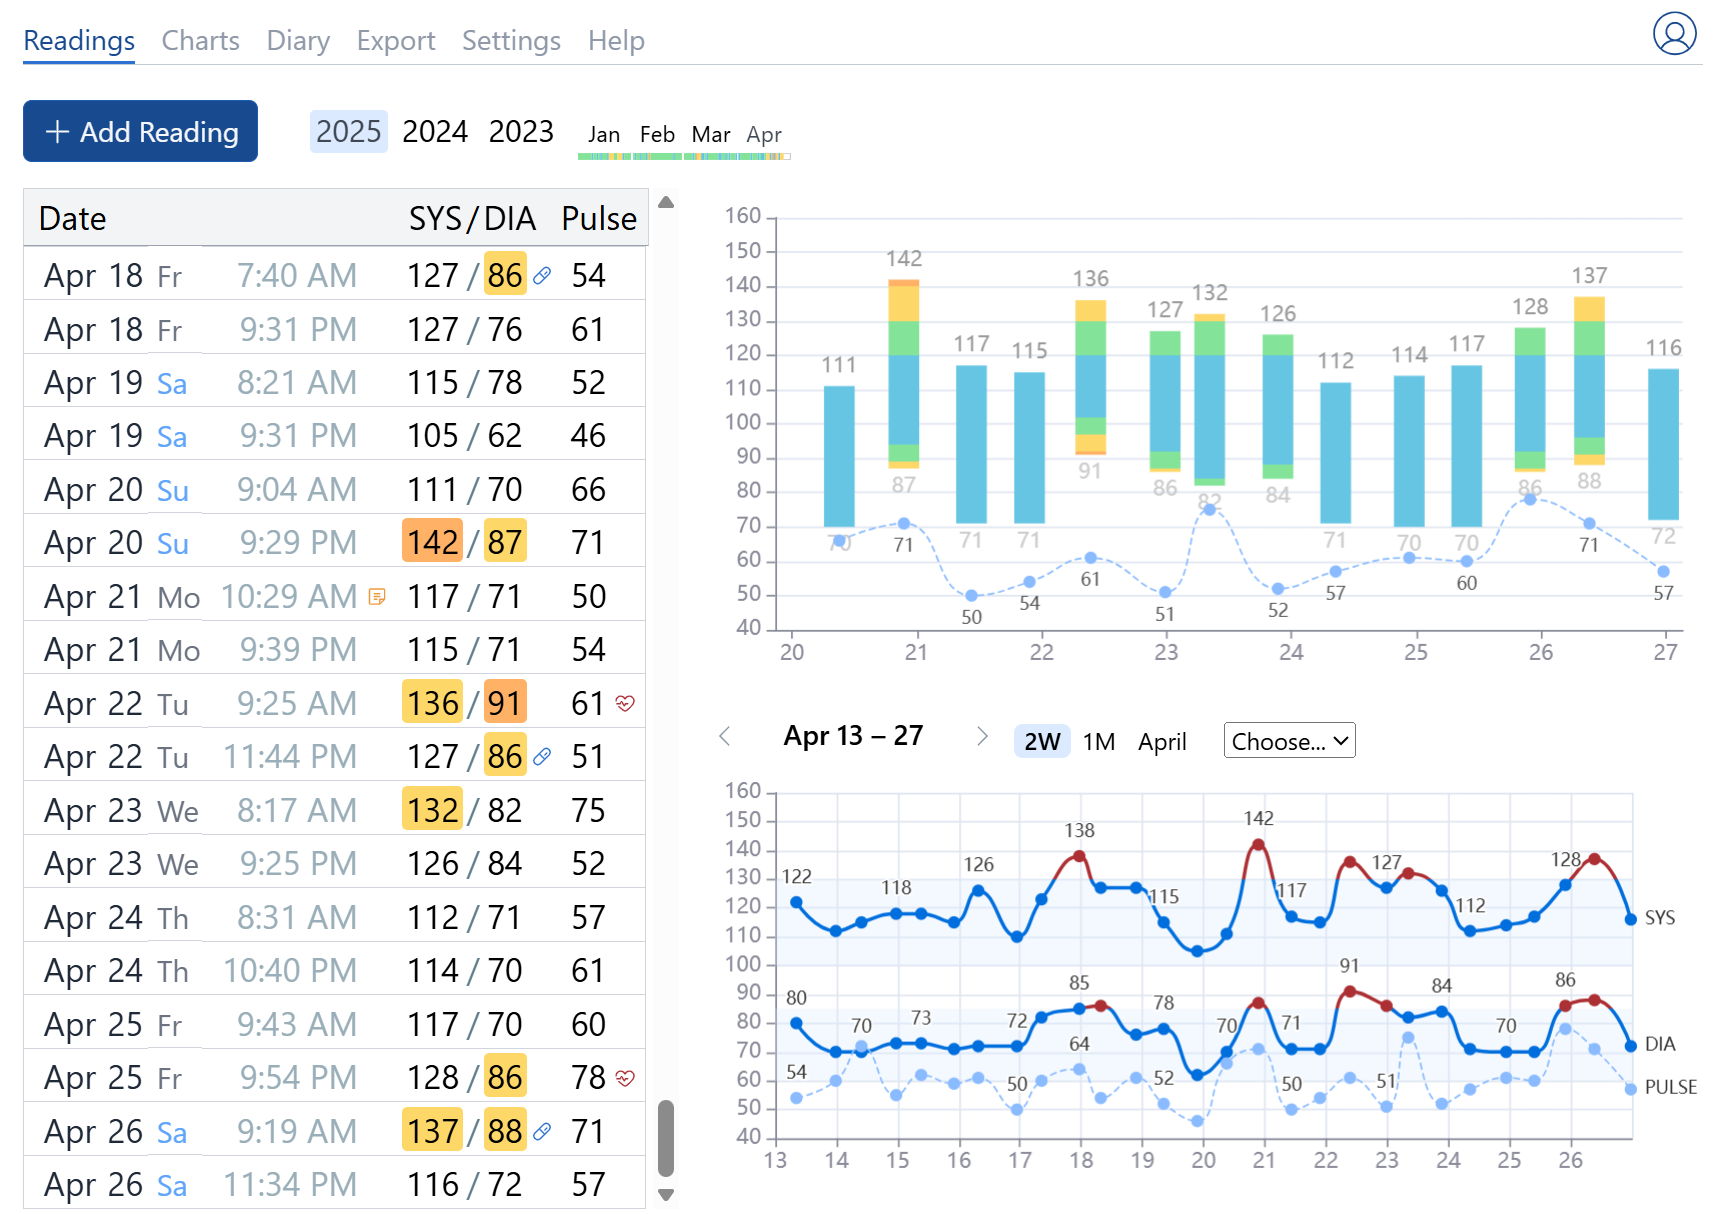
Reading Journal
The reading journal is a table where each row represents a blood pressure reading: date and time of measurement, systolic pressure (SYS), diastolic pressure (DIA), pulse rate. If enabled in the Settings, additional values such as notes, medication, and irregular pulse are displayed as icons.
Adding a New Reading
To add a blood pressure reading, click the 
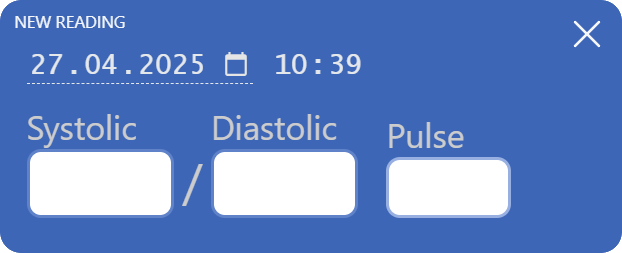
Fill in the fields for systolic pressure, diastolic pressure, and pulse rate.
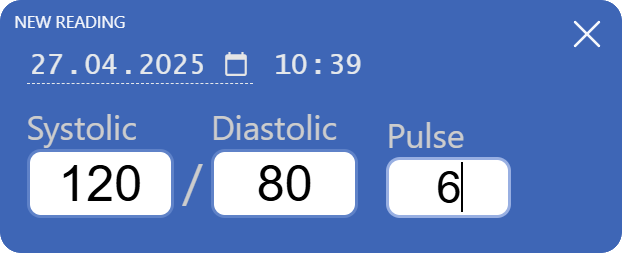
Data entry is simplified: you only need to input numbers. The form will automatically close after you enter the final digit, and the reading will be saved.
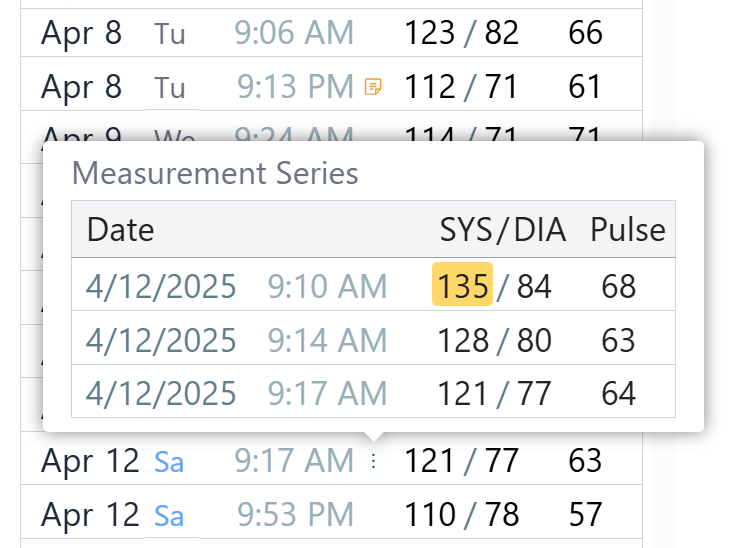
Measurement Series
The app supports measurement series to improve accuracy by selecting either the lowest values or the average of multiple readings. The “collapse” algorithm can be changed in the Settings. By default, minimum values are taken for each parameter in the series.
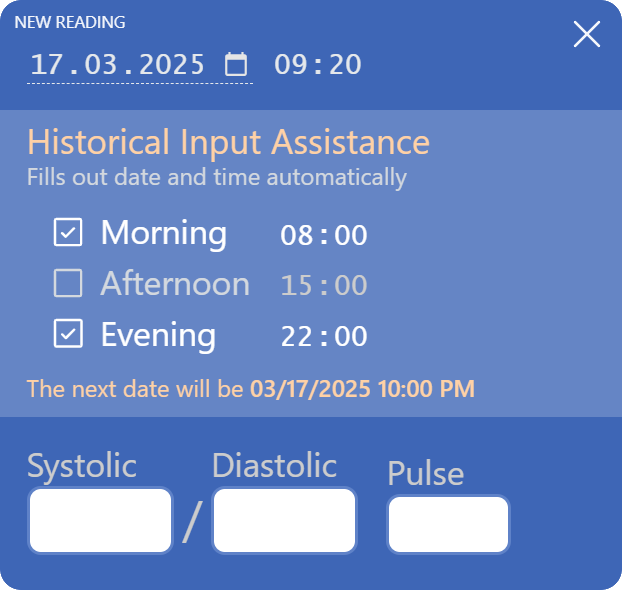
Historical Input Helper
If you’re entering readings for dates before yesterday, the form shows an extra section where you can set up to three daily measurement times. Once data for one day is entered, the form automatically moves to the next day and selects one of your chosen times.
Charts
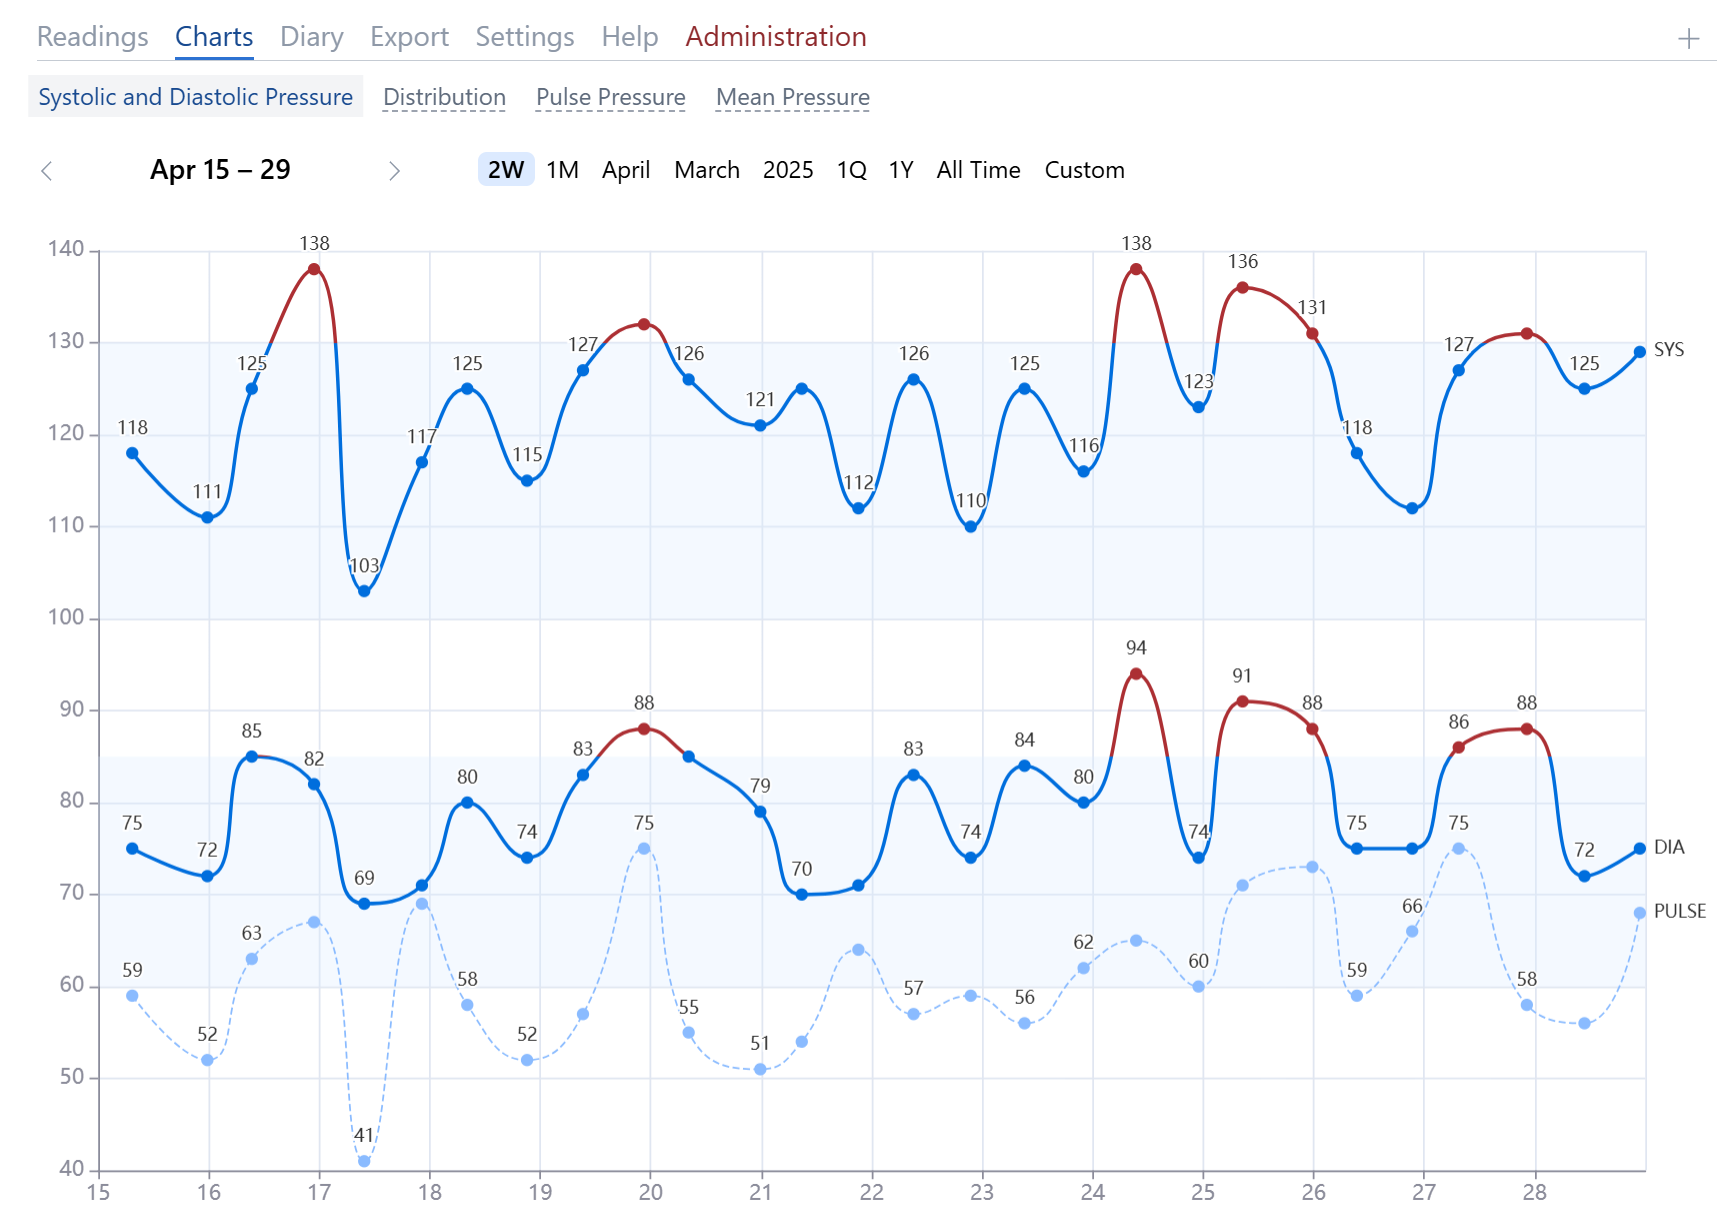
Blood Pressure Chart
This chart displays the three main indicators measured by the blood pressure monitor: systolic (SYS) pressure, diastolic (DIA) pressure, and pulse rate. Light blue background areas denote the range of normal blood pressure.
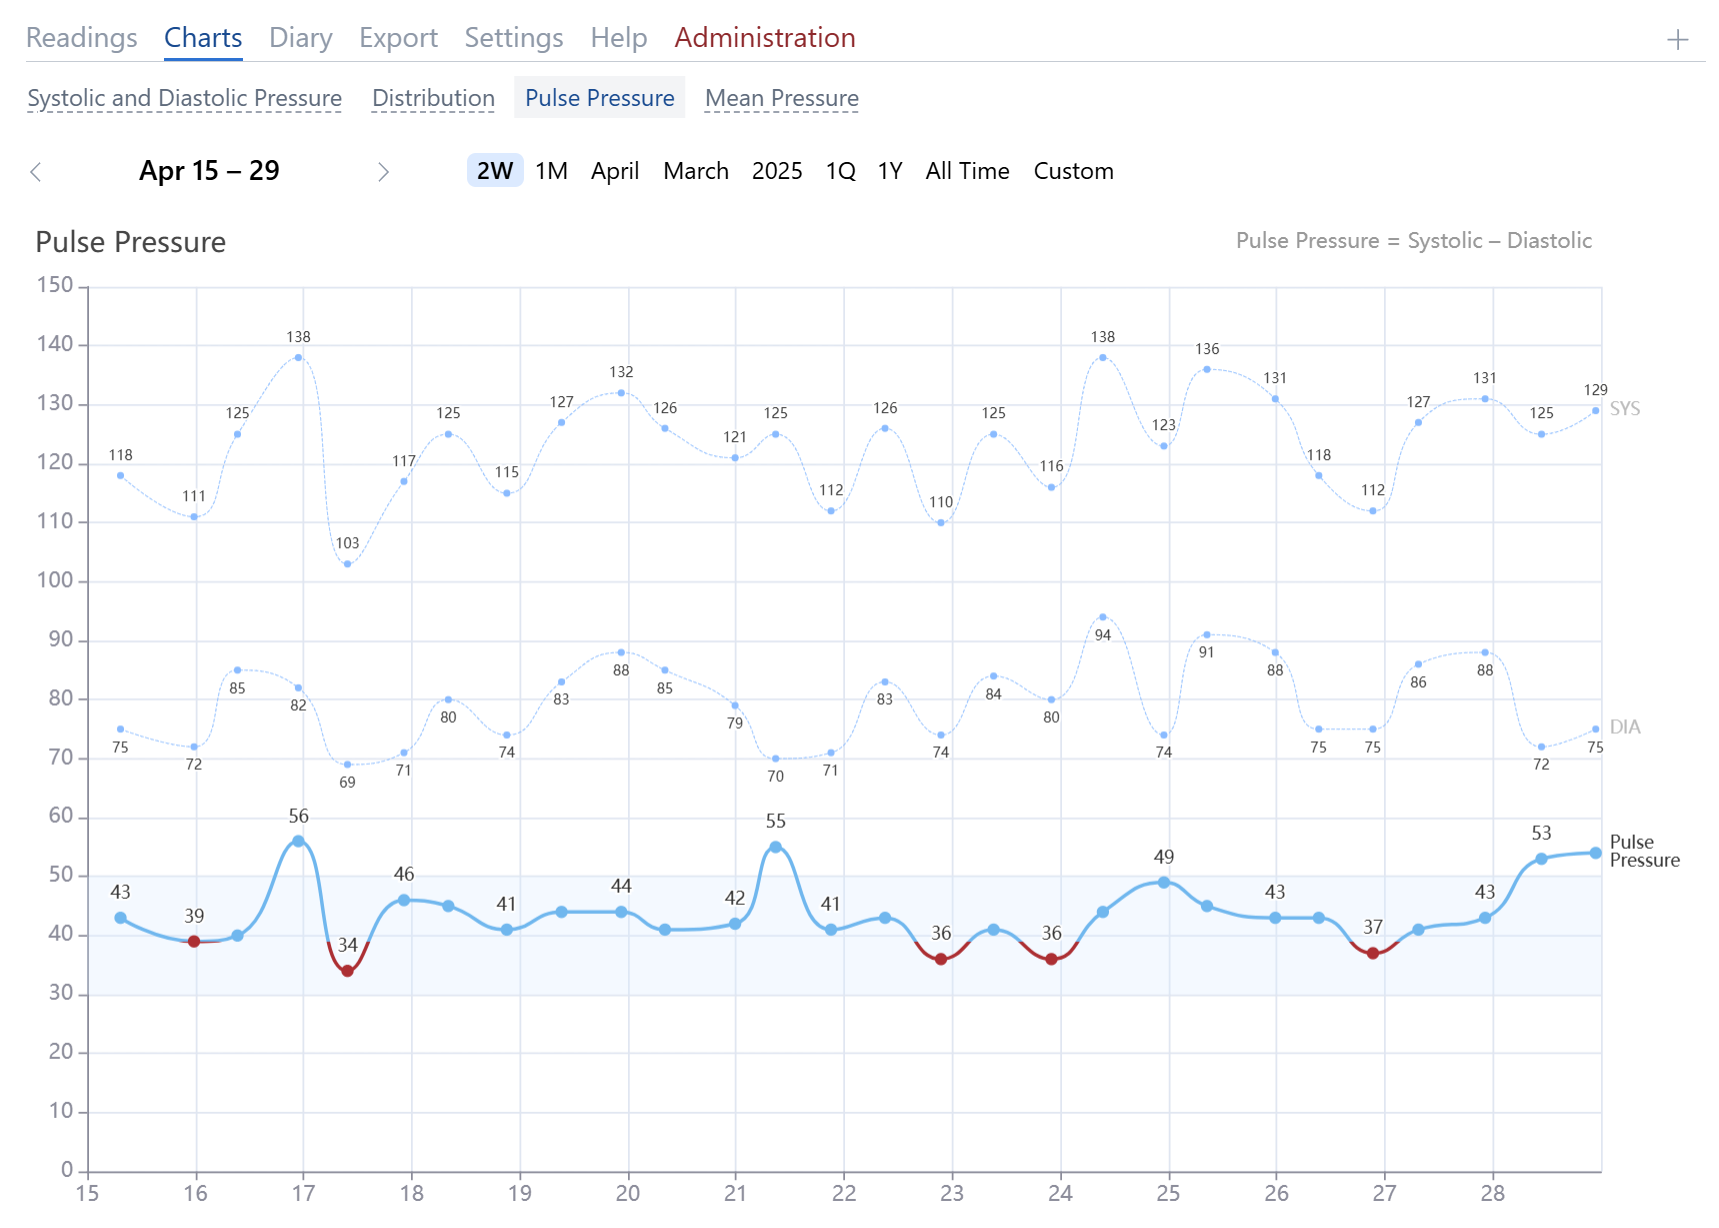
Pulse Pressure Chart
This chart shows pulse pressure values, calculated as the difference between systolic and diastolic pressures. Normal pulse pressure ranges from 40 to 50 mmHg. Higher pulse pressures indicate greater arterial wall stress and increased cardiovascular risks. Persistently high pulse pressure (above 60 mmHg) can stiffen and damage arterial walls. Low pulse pressure (below 40 mmHg) may indicate heart failure, significant blood loss, or aortic stenosis.
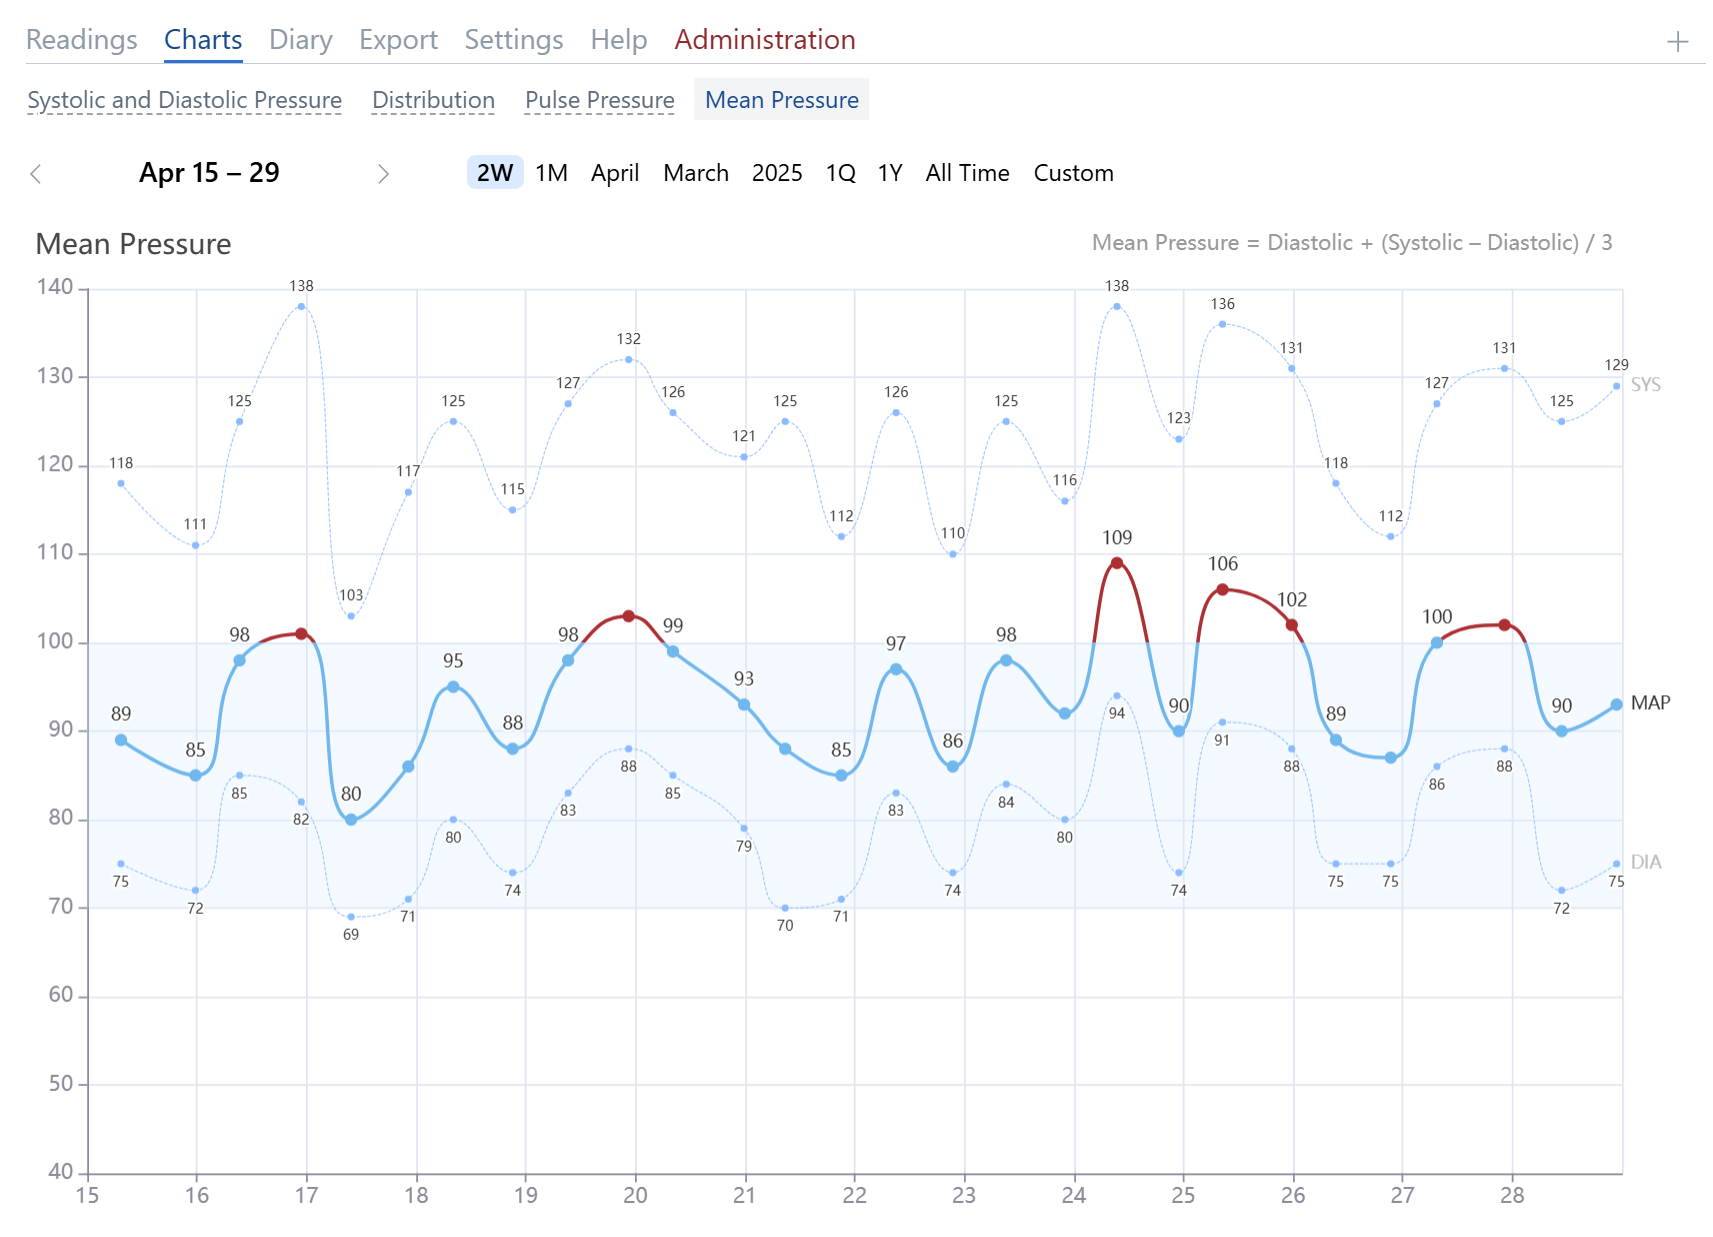
Mean Arterial Pressure Chart
Mean arterial pressure (MAP) is calculated as:
1/3 SYS + 2/3 DIA
where SYS is the systolic pressure and DIA is the diastolic pressure.
MAP is a key indicator of organ blood supply. MAP above 90 mmHg is linked to a higher risk of cardiovascular disease. Extremely high MAP (over 110 mmHg) may indicate cardiovascular stress, while MAP below 60 mmHg risks insufficient organ perfusion.
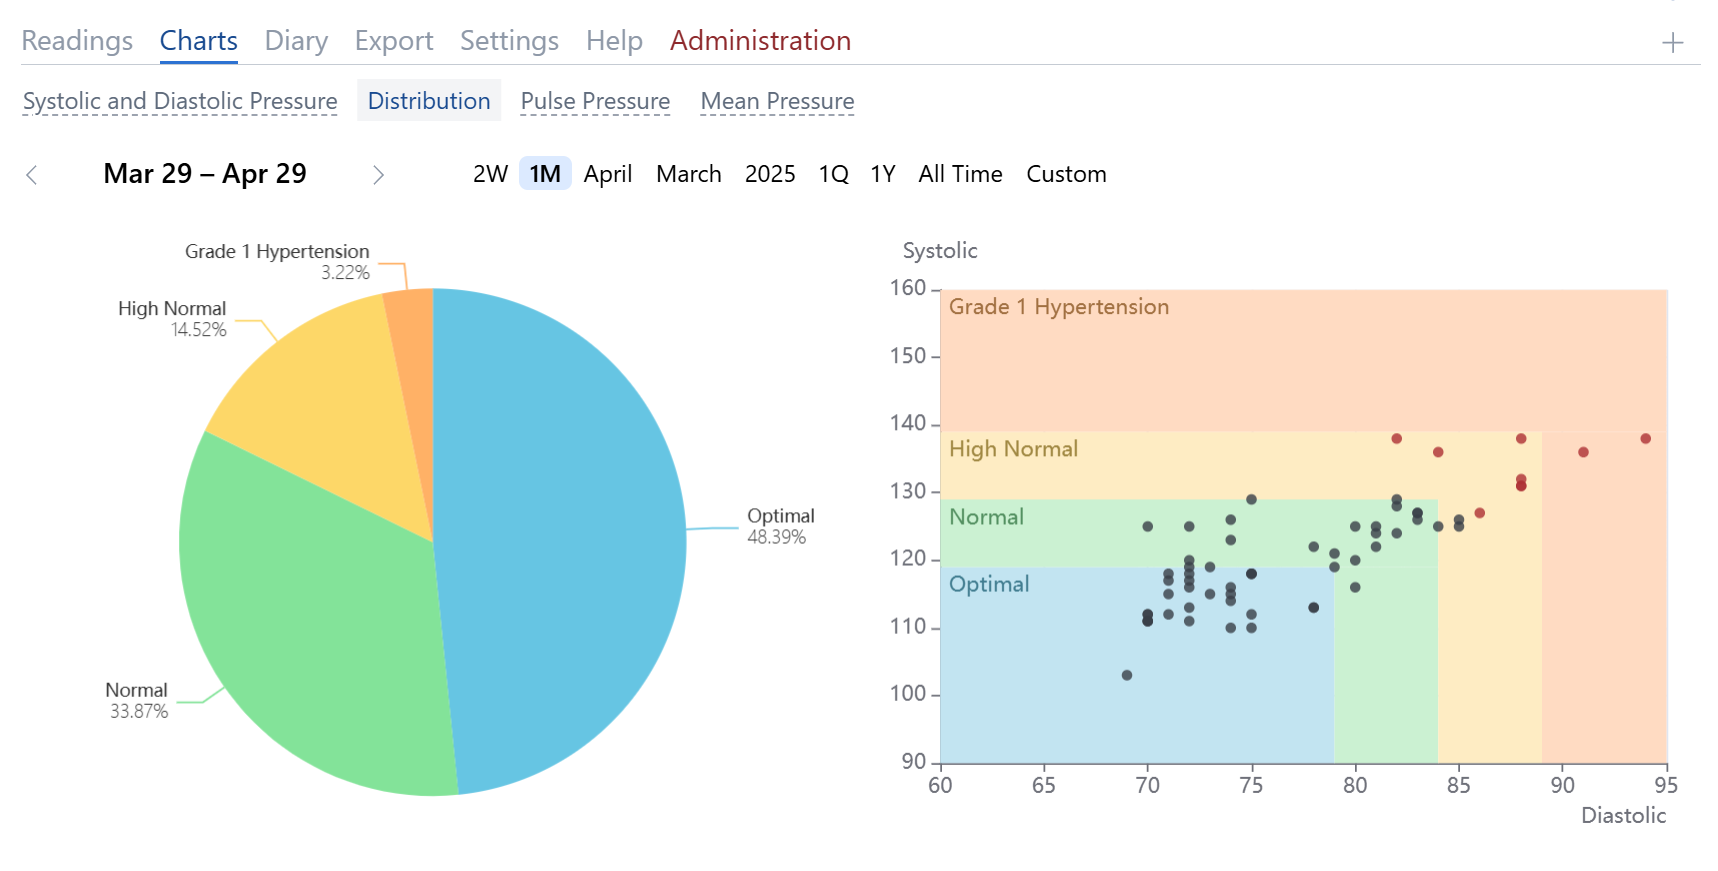
Blood Pressure Distribution Charts
These charts show the percentage and structural distribution of blood pressure values by categories.
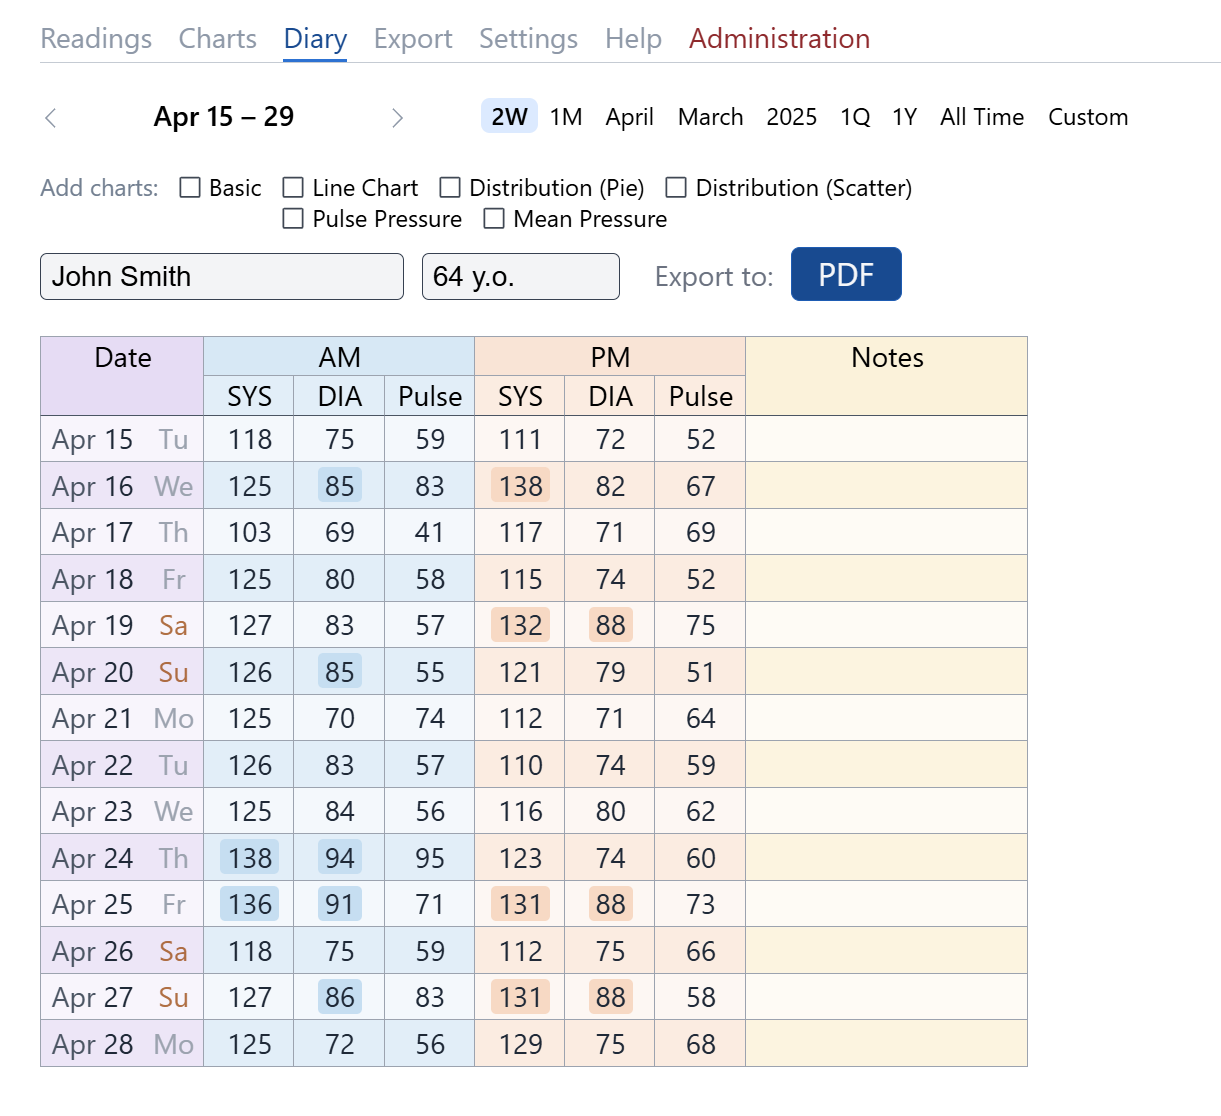
Morning and Evening Diary
This standard diary format is often assigned by doctors in clinics. Each diary row records the date, blood pressure, and pulse readings for the morning and evening.
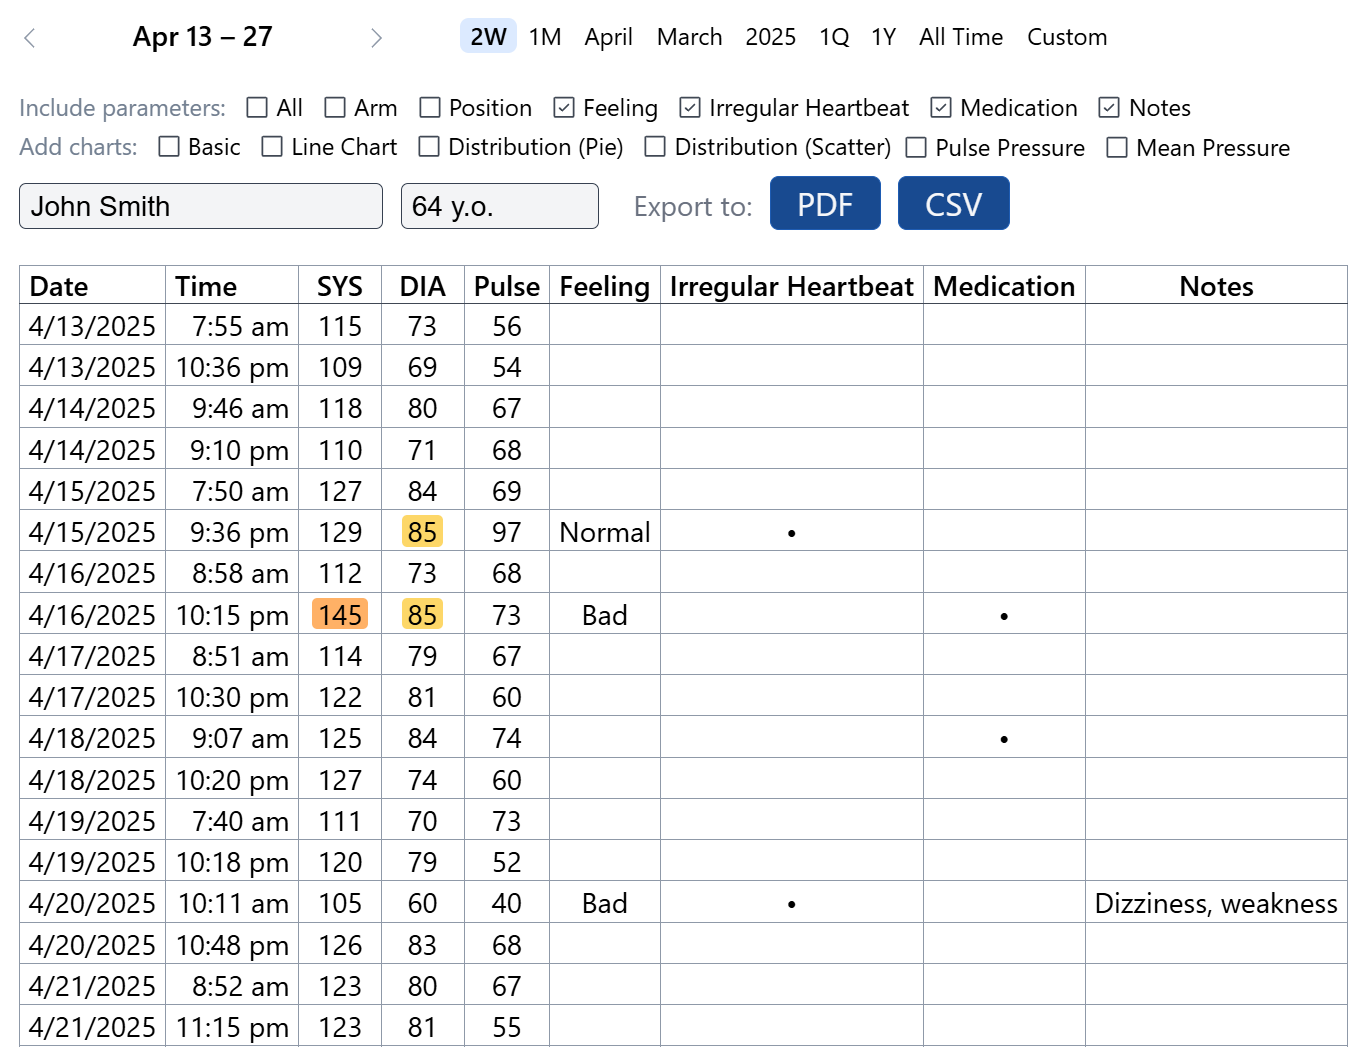
Data Export
All data can be exported as PDF or CSV files. You can optionally include one or more charts in the PDF document.
Settings
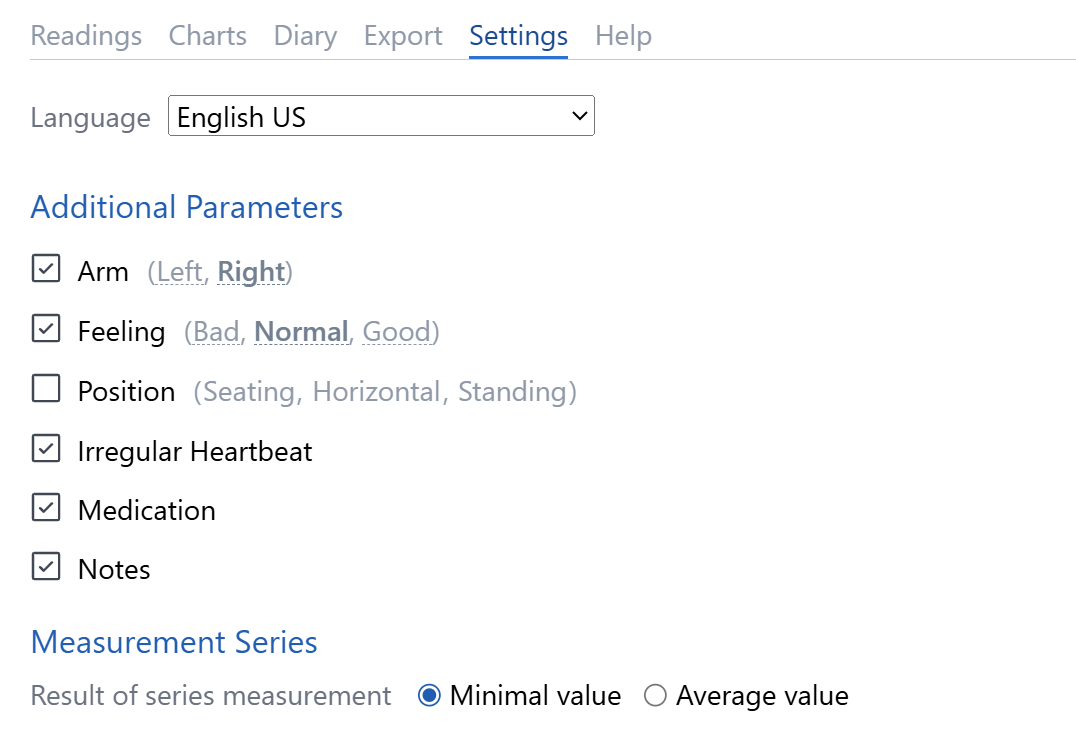
Additional Parameters
In Settings, you can enable additional fields for blood pressure entry:
- Arm (which arm was used for measurement)
- Well-being (how the user felt during measurement)
- Position (sitting, standing, or lying down)
- Arrhythmia (irregular heartbeat detected by some monitors)
- Medication (if taken before measurement)
- Notes (any comments related to the measurement)
Measurement Series
You can configure the algorithm for measurement series: choose either the minimum or average values.